> ## Documentation Index
> Fetch the complete documentation index at: https://test-8ad8522e-feat-ai-sre.mintlify.site/llms.txt
> Use this file to discover all available pages before exploring further.
# Issue Overview and Details
> Learn how Flashduty RUM groups errors into Issues and how to inspect occurrences, stacks, affected users, and related context.
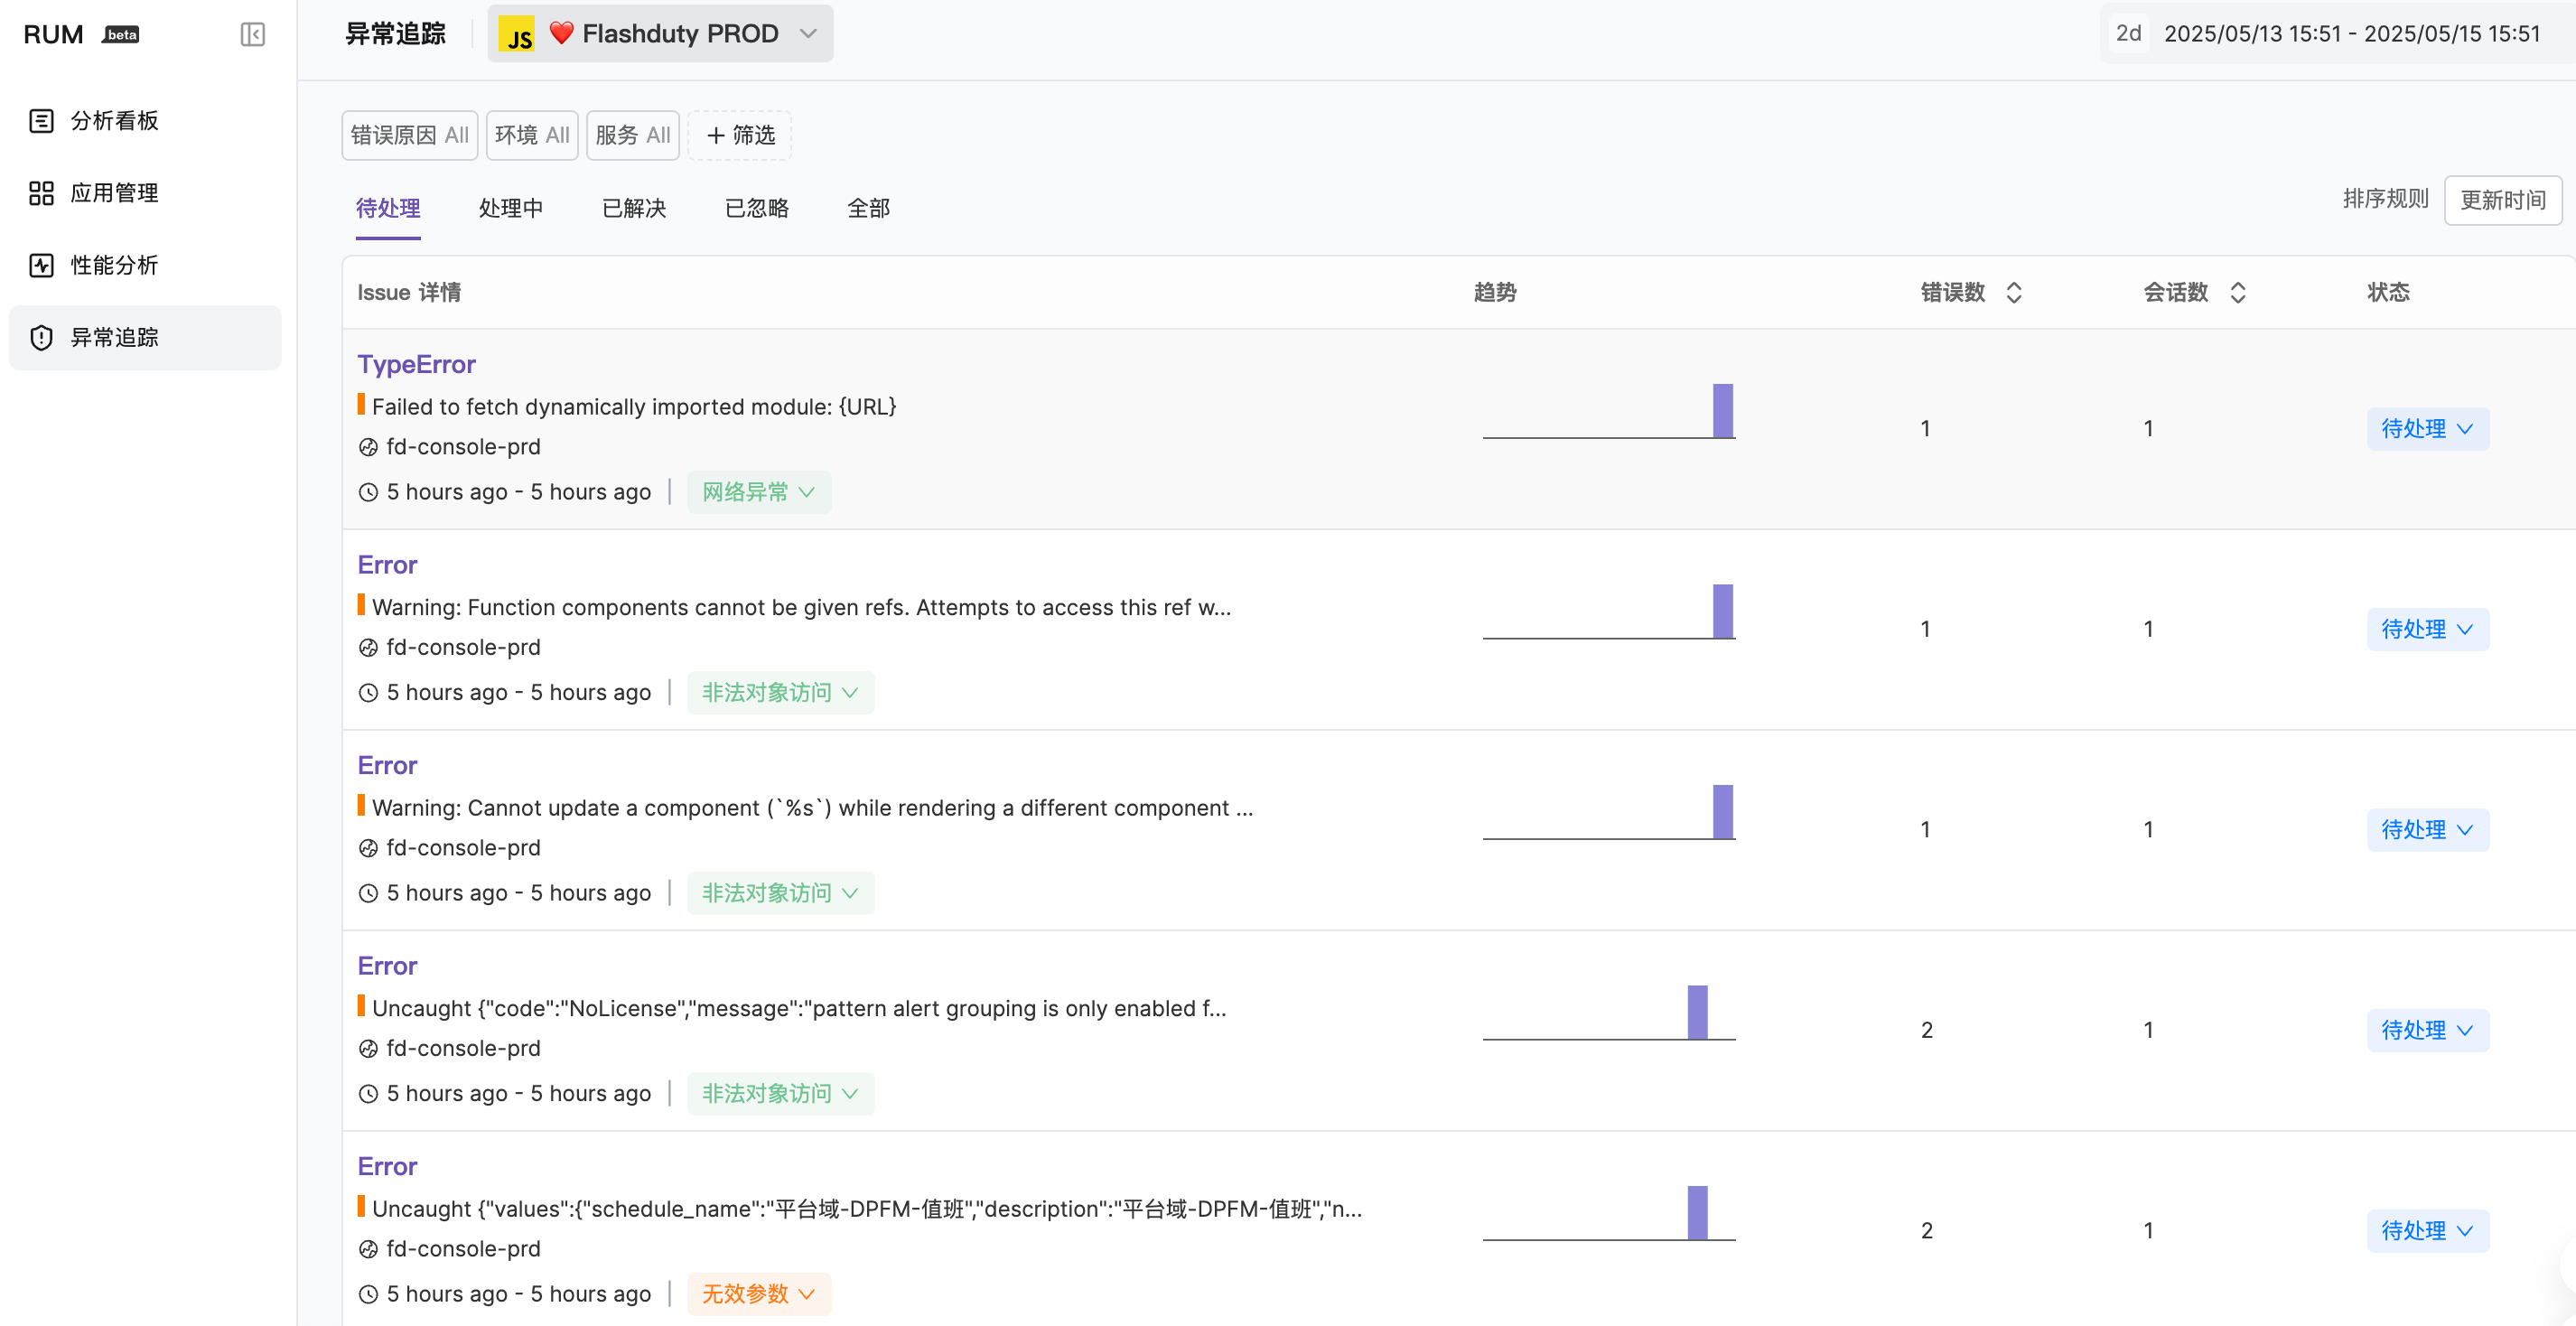
After errors are reported, you can view Issues in the Error Tracking module. In RUM, an Issue is a group of similar errors, typically related to the same bug.
 For detailed grouping rules, please refer to [Error Grouping](./error-aggregation).
## Issue Information Overview
For detailed grouping rules, please refer to [Error Grouping](./error-aggregation).
## Issue Information Overview
 Each entry listed in the Issue browser contains the following information:
| Item | Description |
| ---------------------------------------- | ---------------------------------------------------------------------------------------------------------------------------------------------------------------------- |
| Error type and error message | Core identifying information of the Issue |
| File path where error occurred | Locate error source |
| Service name | Associated service |
| Error cause | System-inferred possible root cause |
| Priority | Issue priority (`Critical`, `Warning`, `Info`), determined automatically by alert severity rules or the scoring system; legacy records may be empty and display as `—` |
| Whether issue has regressed | Indicates if a resolved issue has reappeared |
| First and last occurrence time | Issue lifecycle information |
| Occurrence count chart | Trend over time |
| Occurrence count in selected time period | Statistical data |
The Issue list can be **sorted by priority**, and the Priority filter is included in the default filters. The accent bar to the left of each Issue's error message reflects its priority (`Critical` red, `Warning` orange, `Info` light orange; gray when no priority data exists). Priority is determined by alert rules or the scoring system and cannot be edited manually; it is also shown at the top of the Issue detail page.
## Issue Status
Issues have 4 statuses, with transitions as follows:
Each entry listed in the Issue browser contains the following information:
| Item | Description |
| ---------------------------------------- | ---------------------------------------------------------------------------------------------------------------------------------------------------------------------- |
| Error type and error message | Core identifying information of the Issue |
| File path where error occurred | Locate error source |
| Service name | Associated service |
| Error cause | System-inferred possible root cause |
| Priority | Issue priority (`Critical`, `Warning`, `Info`), determined automatically by alert severity rules or the scoring system; legacy records may be empty and display as `—` |
| Whether issue has regressed | Indicates if a resolved issue has reappeared |
| First and last occurrence time | Issue lifecycle information |
| Occurrence count chart | Trend over time |
| Occurrence count in selected time period | Statistical data |
The Issue list can be **sorted by priority**, and the Priority filter is included in the default filters. The accent bar to the left of each Issue's error message reflects its priority (`Critical` red, `Warning` orange, `Info` light orange; gray when no priority data exists). Priority is determined by alert rules or the scoring system and cannot be edited manually; it is also shown at the top of the Issue detail page.
## Issue Status
Issues have 4 statuses, with transitions as follows:
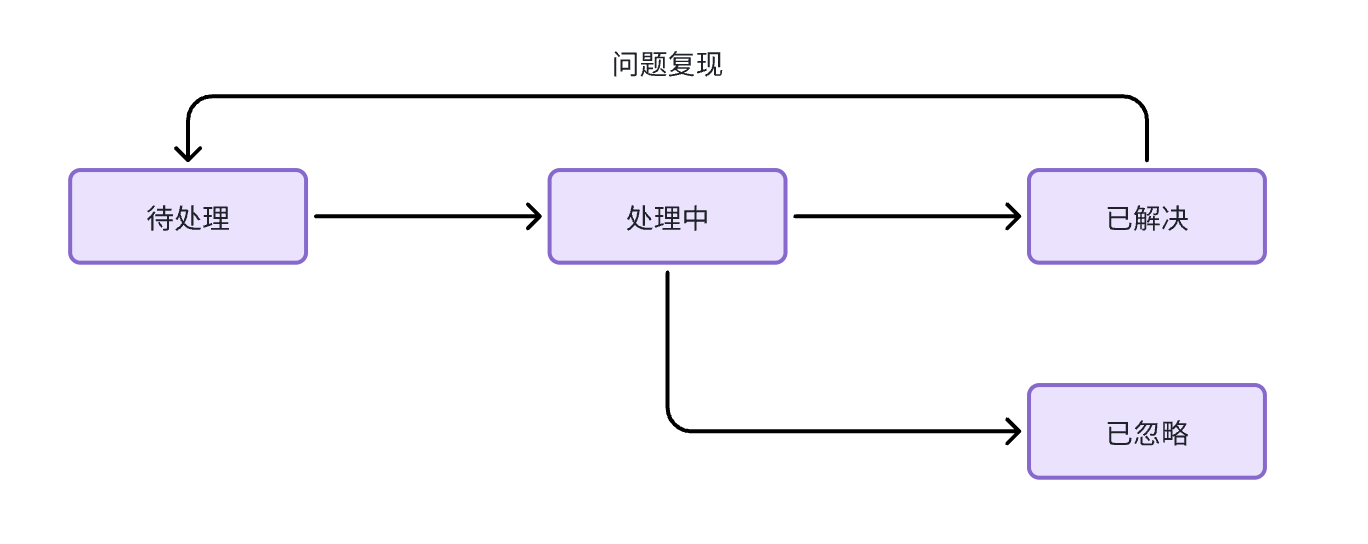 | Status | Description |
| -------------- | ------------------------------------------- |
| **For Review** | Newly discovered issues that need attention |
| **Reviewed** | Confirmed issues being fixed |
| **Resolved** | Issues that have been fixed |
| **Ignored** | Issues that don't need handling |
For regression-related transition logic, please refer to [Issue Status](./issue-status).
## Filtering and Sorting
The timeline in the upper right corner of the browser allows you to display Issues that had errors during the selected time period. You can:
* Select a preset range from the dropdown menu
* Directly modify the time
* Enter natural language for filtering
| Sort Option | Description |
| ----------------- | ------------------------------------------------------ |
| Update Time | Sort by issue update time (default) |
| Create Time | Sort by first discovery time |
| Occurrence Count | Sort by total error occurrences in selected time range |
| Affected Sessions | Sort by number of affected RUM sessions |
RUM automatically indexes predefined attributes for your Issues and creates corresponding filters.
| Status | Description |
| -------------- | ------------------------------------------- |
| **For Review** | Newly discovered issues that need attention |
| **Reviewed** | Confirmed issues being fixed |
| **Resolved** | Issues that have been fixed |
| **Ignored** | Issues that don't need handling |
For regression-related transition logic, please refer to [Issue Status](./issue-status).
## Filtering and Sorting
The timeline in the upper right corner of the browser allows you to display Issues that had errors during the selected time period. You can:
* Select a preset range from the dropdown menu
* Directly modify the time
* Enter natural language for filtering
| Sort Option | Description |
| ----------------- | ------------------------------------------------------ |
| Update Time | Sort by issue update time (default) |
| Create Time | Sort by first discovery time |
| Occurrence Count | Sort by total error occurrences in selected time range |
| Affected Sessions | Sort by number of affected RUM sessions |
RUM automatically indexes predefined attributes for your Issues and creates corresponding filters.
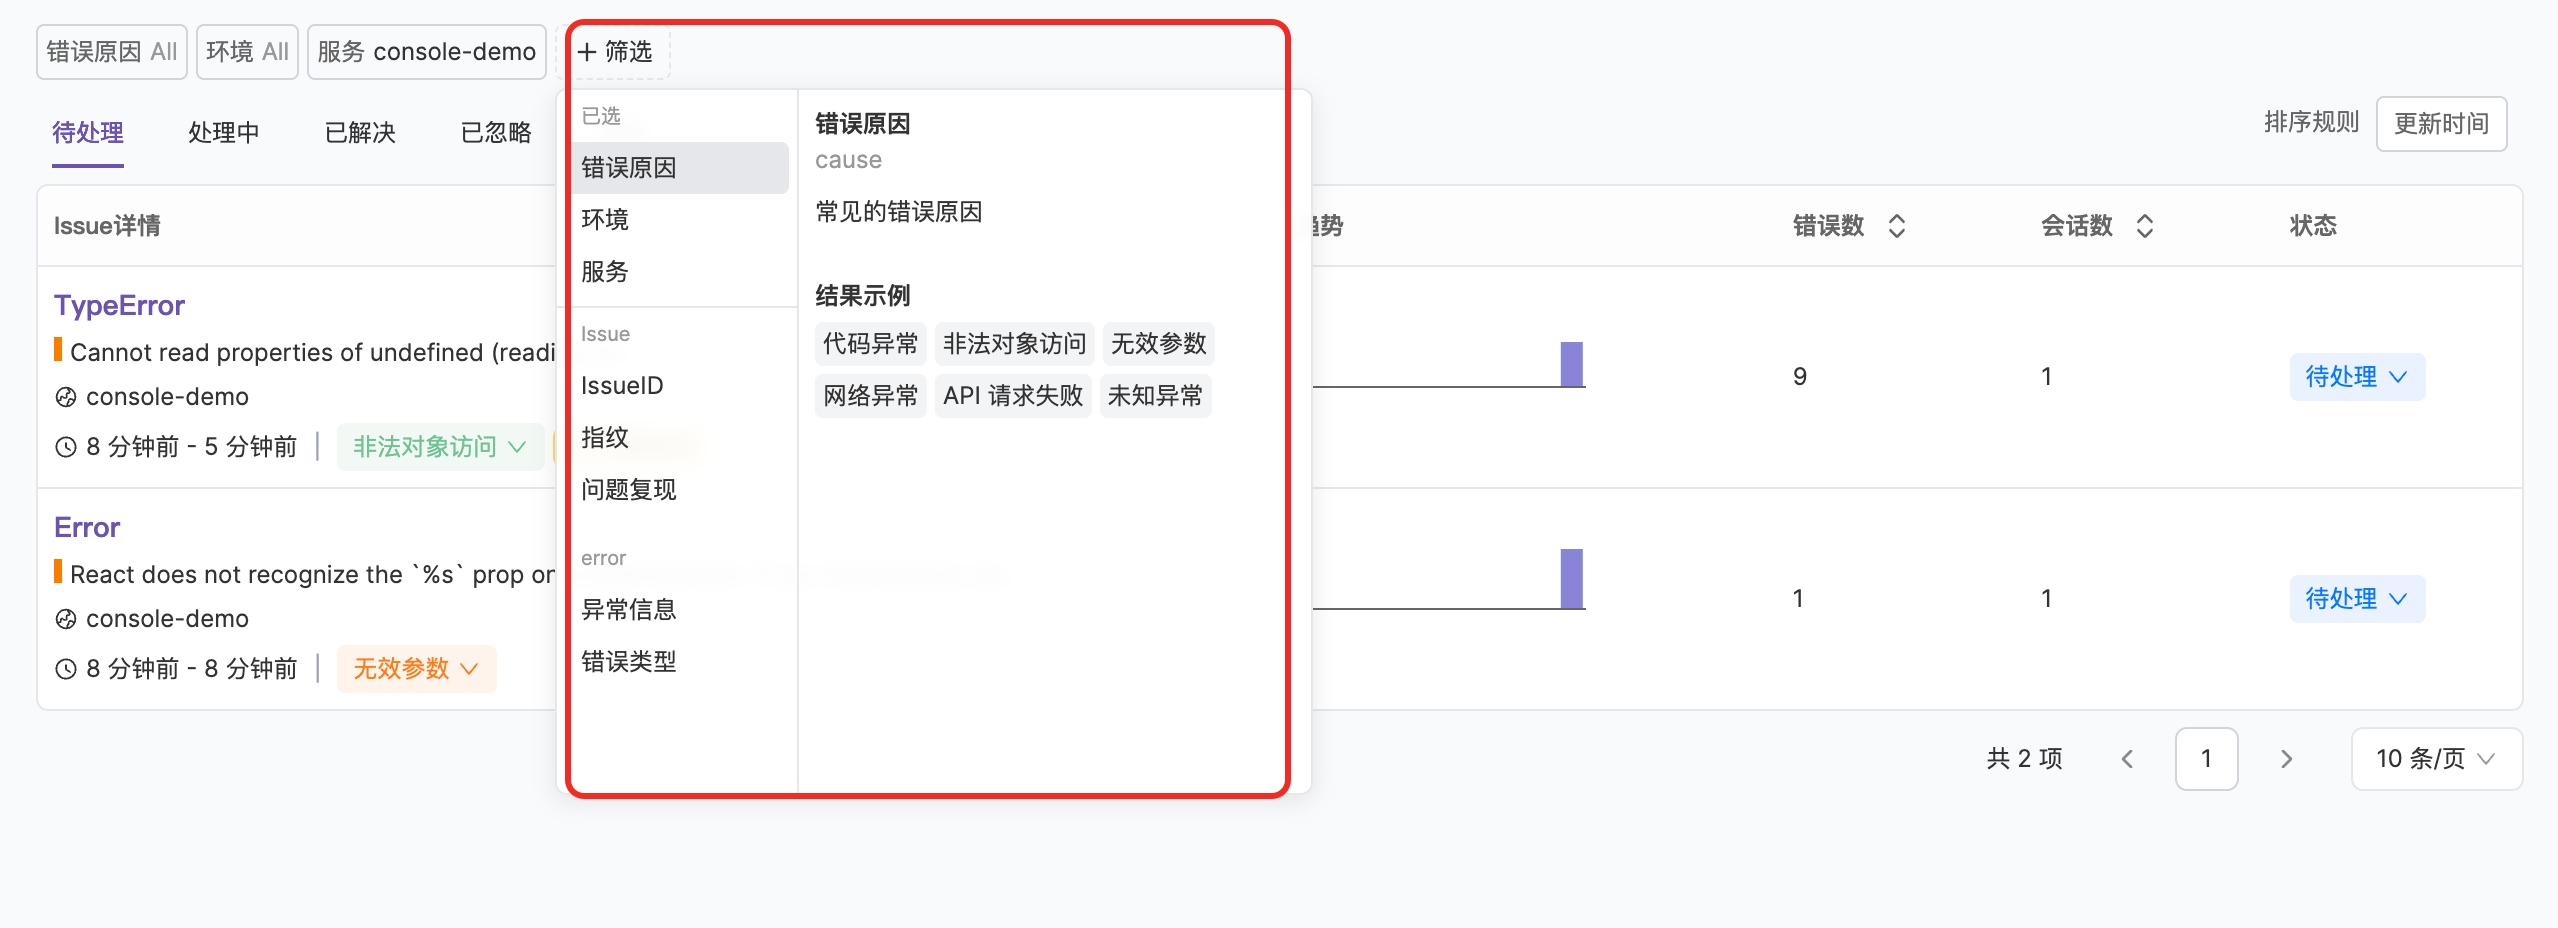 Supported attributes include:
| Attribute | Description |
| ------------- | ------------------------------------------------------------------------------------------------ |
| Error Cause | Possible root cause type when error occurred |
| Environment | The env field when Issue was reported |
| Service | The service field when Issue was reported |
| Error Type | The error.type field in the reported error event |
| Error Message | The error.message field in the error event, supports fuzzy matching |
| Issue ID | ID when Issue was grouped, multiple IDs can be separated by commas |
| Regression | If a resolved issue occurs again, the Issue will be marked as regressed |
| Fingerprint | Fingerprint information when Issue was grouped, multiple fingerprints can be separated by commas |
## Export Issues
The **CSV** export button at the top right of the Issue list exports data that matches the list's current filters and sort order.
After clicking the CSV button, you can choose what to include in the export popover:
| Option | Default | Description |
| -------------------------------- | ------- | ------------------------------------------------------------------------------------------------------------------------------------------------------------------------------------------- |
| Include error samples | On | Attaches the most recent error sample columns to each Issue (time, version, view, session ID, device, OS, browser, stack), prefixed `sample_` |
| Also include the earliest sample | Off | Additionally attaches the earliest error sample columns (`sample_first_*`), useful for finding the version a problem first appeared in. Only selectable while "Include error samples" is on |
Error samples only exist within the error data retention window; older Issues export with empty sample columns.
The export always includes the Issue's 18 fields (Issue ID, Issue URL, Application, Service, Error type, Error message, Status, Severity, Is crash, Error count, Affected sessions, First seen, First seen version, Last seen, Last seen version, Versions, Suspected cause, Resolved at); the sample columns are appended when "Include error samples" is enabled.
* A single export is capped at **100 rows**. When more than 100 Issues match, a tooltip on the button says "At most 100 rows can be exported. Narrow the time range or add filters."; if the exported file was truncated, the page shows a toast with the exported count.
* Time columns (First seen / Last seen / Resolved at / sample time) carry the timezone in the header (e.g. `First seen (Asia/Shanghai)`) with cell values as `YYYY-MM-DD HH:mm:ss` text in that timezone, so spreadsheets sort them as dates.
* Sample stacks are truncated to the first 20 lines. Full stacks are available in the Issue detail (where they are symbolicated per platform); the export contains the raw frames as reported, without symbolication.
* To prevent formula injection, cells starting with `=`, `+`, `-`, or `@` are prefixed with a quote.
## Error Cause Classification
Flashcat adds an error cause classification to each Issue when created, helping improve fault localization efficiency.
| Error Cause | Description |
| --------------------- | ---------------------------------------------- |
| Code Error | Errors caused by code defects |
| Illegal Object Access | Code accessed a null or undefined object |
| Invalid Parameter | Function called with invalid parameters |
| Network Error | Server response too slow or poor network speed |
| API Request Failed | API endpoint returned an error status code |
| Unknown Error | Unable to locate this error type |
When hovering over an error cause classification, the system will use AI capabilities to provide inferred root causes and fix suggestions.
### Classification Mechanism
The system uses a two-layer analysis mechanism to classify errors:
**Layer 1: Pattern Matching**
The rule engine checks error types and messages in priority order; the first matching rule determines the classification:
| Check Order | Match Condition | Classification |
| ----------- | ------------------------------------------------------------------------------------------------------------ | --------------------- |
| 1 | Error message contains "Unexpected token ... is not valid JSON" | Invalid Parameter |
| 2 | Associated resource HTTP status code is 4xx or 5xx | API Request Failed |
| 3 | Error type contains "Network" or "AbortError" | Network Error |
| 4 | Error type contains "Syntax", "Reference", "Range", "URI", or "Eval" | Code Error |
| 5 | Error type is TypeError and message matches null access patterns (e.g., "Cannot read property of undefined") | Illegal Object Access |
| 6 | Error message matches invalid argument patterns (e.g., "invalid argument", "unexpected token") | Invalid Parameter |
| 7 | Error message contains "API ERROR:" or license-related errors | API Request Failed |
| 8 | Error message contains network connection keywords (e.g., "timeout", "connection", "dns") | Network Error |
| 9 | None of the above matched | Unknown Error |
**Layer 2: AI Inference**
When pattern matching results in "Unknown Error", the system invokes an AI model for deeper analysis. The AI model evaluates the following information:
* **Error Message**: The error description text
* **Stack Trace**: The complete call stack
* **Platform Type**: Browser/JavaScript, Android/Kotlin/Java, iOS/Swift/Objective-C, WeChat Mini Program, etc.
The AI outputs an error classification and a brief cause explanation (up to 100 words). Inference results are displayed as hover tooltips on the Issue card, helping you quickly understand the root cause of the error.
## Regression
Regression refers to previously fixed bugs reappearing.
Supported attributes include:
| Attribute | Description |
| ------------- | ------------------------------------------------------------------------------------------------ |
| Error Cause | Possible root cause type when error occurred |
| Environment | The env field when Issue was reported |
| Service | The service field when Issue was reported |
| Error Type | The error.type field in the reported error event |
| Error Message | The error.message field in the error event, supports fuzzy matching |
| Issue ID | ID when Issue was grouped, multiple IDs can be separated by commas |
| Regression | If a resolved issue occurs again, the Issue will be marked as regressed |
| Fingerprint | Fingerprint information when Issue was grouped, multiple fingerprints can be separated by commas |
## Export Issues
The **CSV** export button at the top right of the Issue list exports data that matches the list's current filters and sort order.
After clicking the CSV button, you can choose what to include in the export popover:
| Option | Default | Description |
| -------------------------------- | ------- | ------------------------------------------------------------------------------------------------------------------------------------------------------------------------------------------- |
| Include error samples | On | Attaches the most recent error sample columns to each Issue (time, version, view, session ID, device, OS, browser, stack), prefixed `sample_` |
| Also include the earliest sample | Off | Additionally attaches the earliest error sample columns (`sample_first_*`), useful for finding the version a problem first appeared in. Only selectable while "Include error samples" is on |
Error samples only exist within the error data retention window; older Issues export with empty sample columns.
The export always includes the Issue's 18 fields (Issue ID, Issue URL, Application, Service, Error type, Error message, Status, Severity, Is crash, Error count, Affected sessions, First seen, First seen version, Last seen, Last seen version, Versions, Suspected cause, Resolved at); the sample columns are appended when "Include error samples" is enabled.
* A single export is capped at **100 rows**. When more than 100 Issues match, a tooltip on the button says "At most 100 rows can be exported. Narrow the time range or add filters."; if the exported file was truncated, the page shows a toast with the exported count.
* Time columns (First seen / Last seen / Resolved at / sample time) carry the timezone in the header (e.g. `First seen (Asia/Shanghai)`) with cell values as `YYYY-MM-DD HH:mm:ss` text in that timezone, so spreadsheets sort them as dates.
* Sample stacks are truncated to the first 20 lines. Full stacks are available in the Issue detail (where they are symbolicated per platform); the export contains the raw frames as reported, without symbolication.
* To prevent formula injection, cells starting with `=`, `+`, `-`, or `@` are prefixed with a quote.
## Error Cause Classification
Flashcat adds an error cause classification to each Issue when created, helping improve fault localization efficiency.
| Error Cause | Description |
| --------------------- | ---------------------------------------------- |
| Code Error | Errors caused by code defects |
| Illegal Object Access | Code accessed a null or undefined object |
| Invalid Parameter | Function called with invalid parameters |
| Network Error | Server response too slow or poor network speed |
| API Request Failed | API endpoint returned an error status code |
| Unknown Error | Unable to locate this error type |
When hovering over an error cause classification, the system will use AI capabilities to provide inferred root causes and fix suggestions.
### Classification Mechanism
The system uses a two-layer analysis mechanism to classify errors:
**Layer 1: Pattern Matching**
The rule engine checks error types and messages in priority order; the first matching rule determines the classification:
| Check Order | Match Condition | Classification |
| ----------- | ------------------------------------------------------------------------------------------------------------ | --------------------- |
| 1 | Error message contains "Unexpected token ... is not valid JSON" | Invalid Parameter |
| 2 | Associated resource HTTP status code is 4xx or 5xx | API Request Failed |
| 3 | Error type contains "Network" or "AbortError" | Network Error |
| 4 | Error type contains "Syntax", "Reference", "Range", "URI", or "Eval" | Code Error |
| 5 | Error type is TypeError and message matches null access patterns (e.g., "Cannot read property of undefined") | Illegal Object Access |
| 6 | Error message matches invalid argument patterns (e.g., "invalid argument", "unexpected token") | Invalid Parameter |
| 7 | Error message contains "API ERROR:" or license-related errors | API Request Failed |
| 8 | Error message contains network connection keywords (e.g., "timeout", "connection", "dns") | Network Error |
| 9 | None of the above matched | Unknown Error |
**Layer 2: AI Inference**
When pattern matching results in "Unknown Error", the system invokes an AI model for deeper analysis. The AI model evaluates the following information:
* **Error Message**: The error description text
* **Stack Trace**: The complete call stack
* **Platform Type**: Browser/JavaScript, Android/Kotlin/Java, iOS/Swift/Objective-C, WeChat Mini Program, etc.
The AI outputs an error classification and a brief cause explanation (up to 100 words). Inference results are displayed as hover tooltips on the Issue card, helping you quickly understand the root cause of the error.
## Regression
Regression refers to previously fixed bugs reappearing.
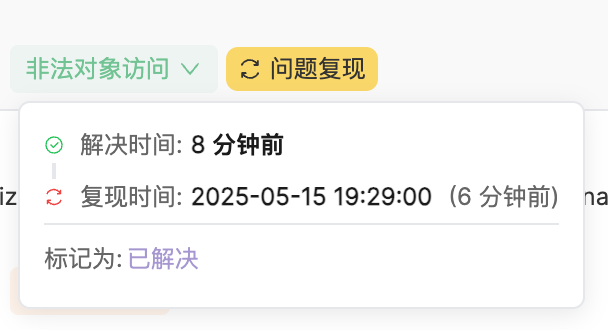 If an error is marked as resolved but the same error occurs later (with a different version), the Issue status will be reopened from the closed state and marked as "Regression".
## Issue Details
The Issue list supports two viewing modes: sidebar mode and fullscreen mode. By default, the details panel opens as a sidebar. You can click the expand button to switch to fullscreen mode for a more spacious view and more complete data display.
Click any Issue to open the details panel and view more information.
If an error is marked as resolved but the same error occurs later (with a different version), the Issue status will be reopened from the closed state and marked as "Regression".
## Issue Details
The Issue list supports two viewing modes: sidebar mode and fullscreen mode. By default, the details panel opens as a sidebar. You can click the expand button to switch to fullscreen mode for a more spacious view and more complete data display.
Click any Issue to open the details panel and view more information.
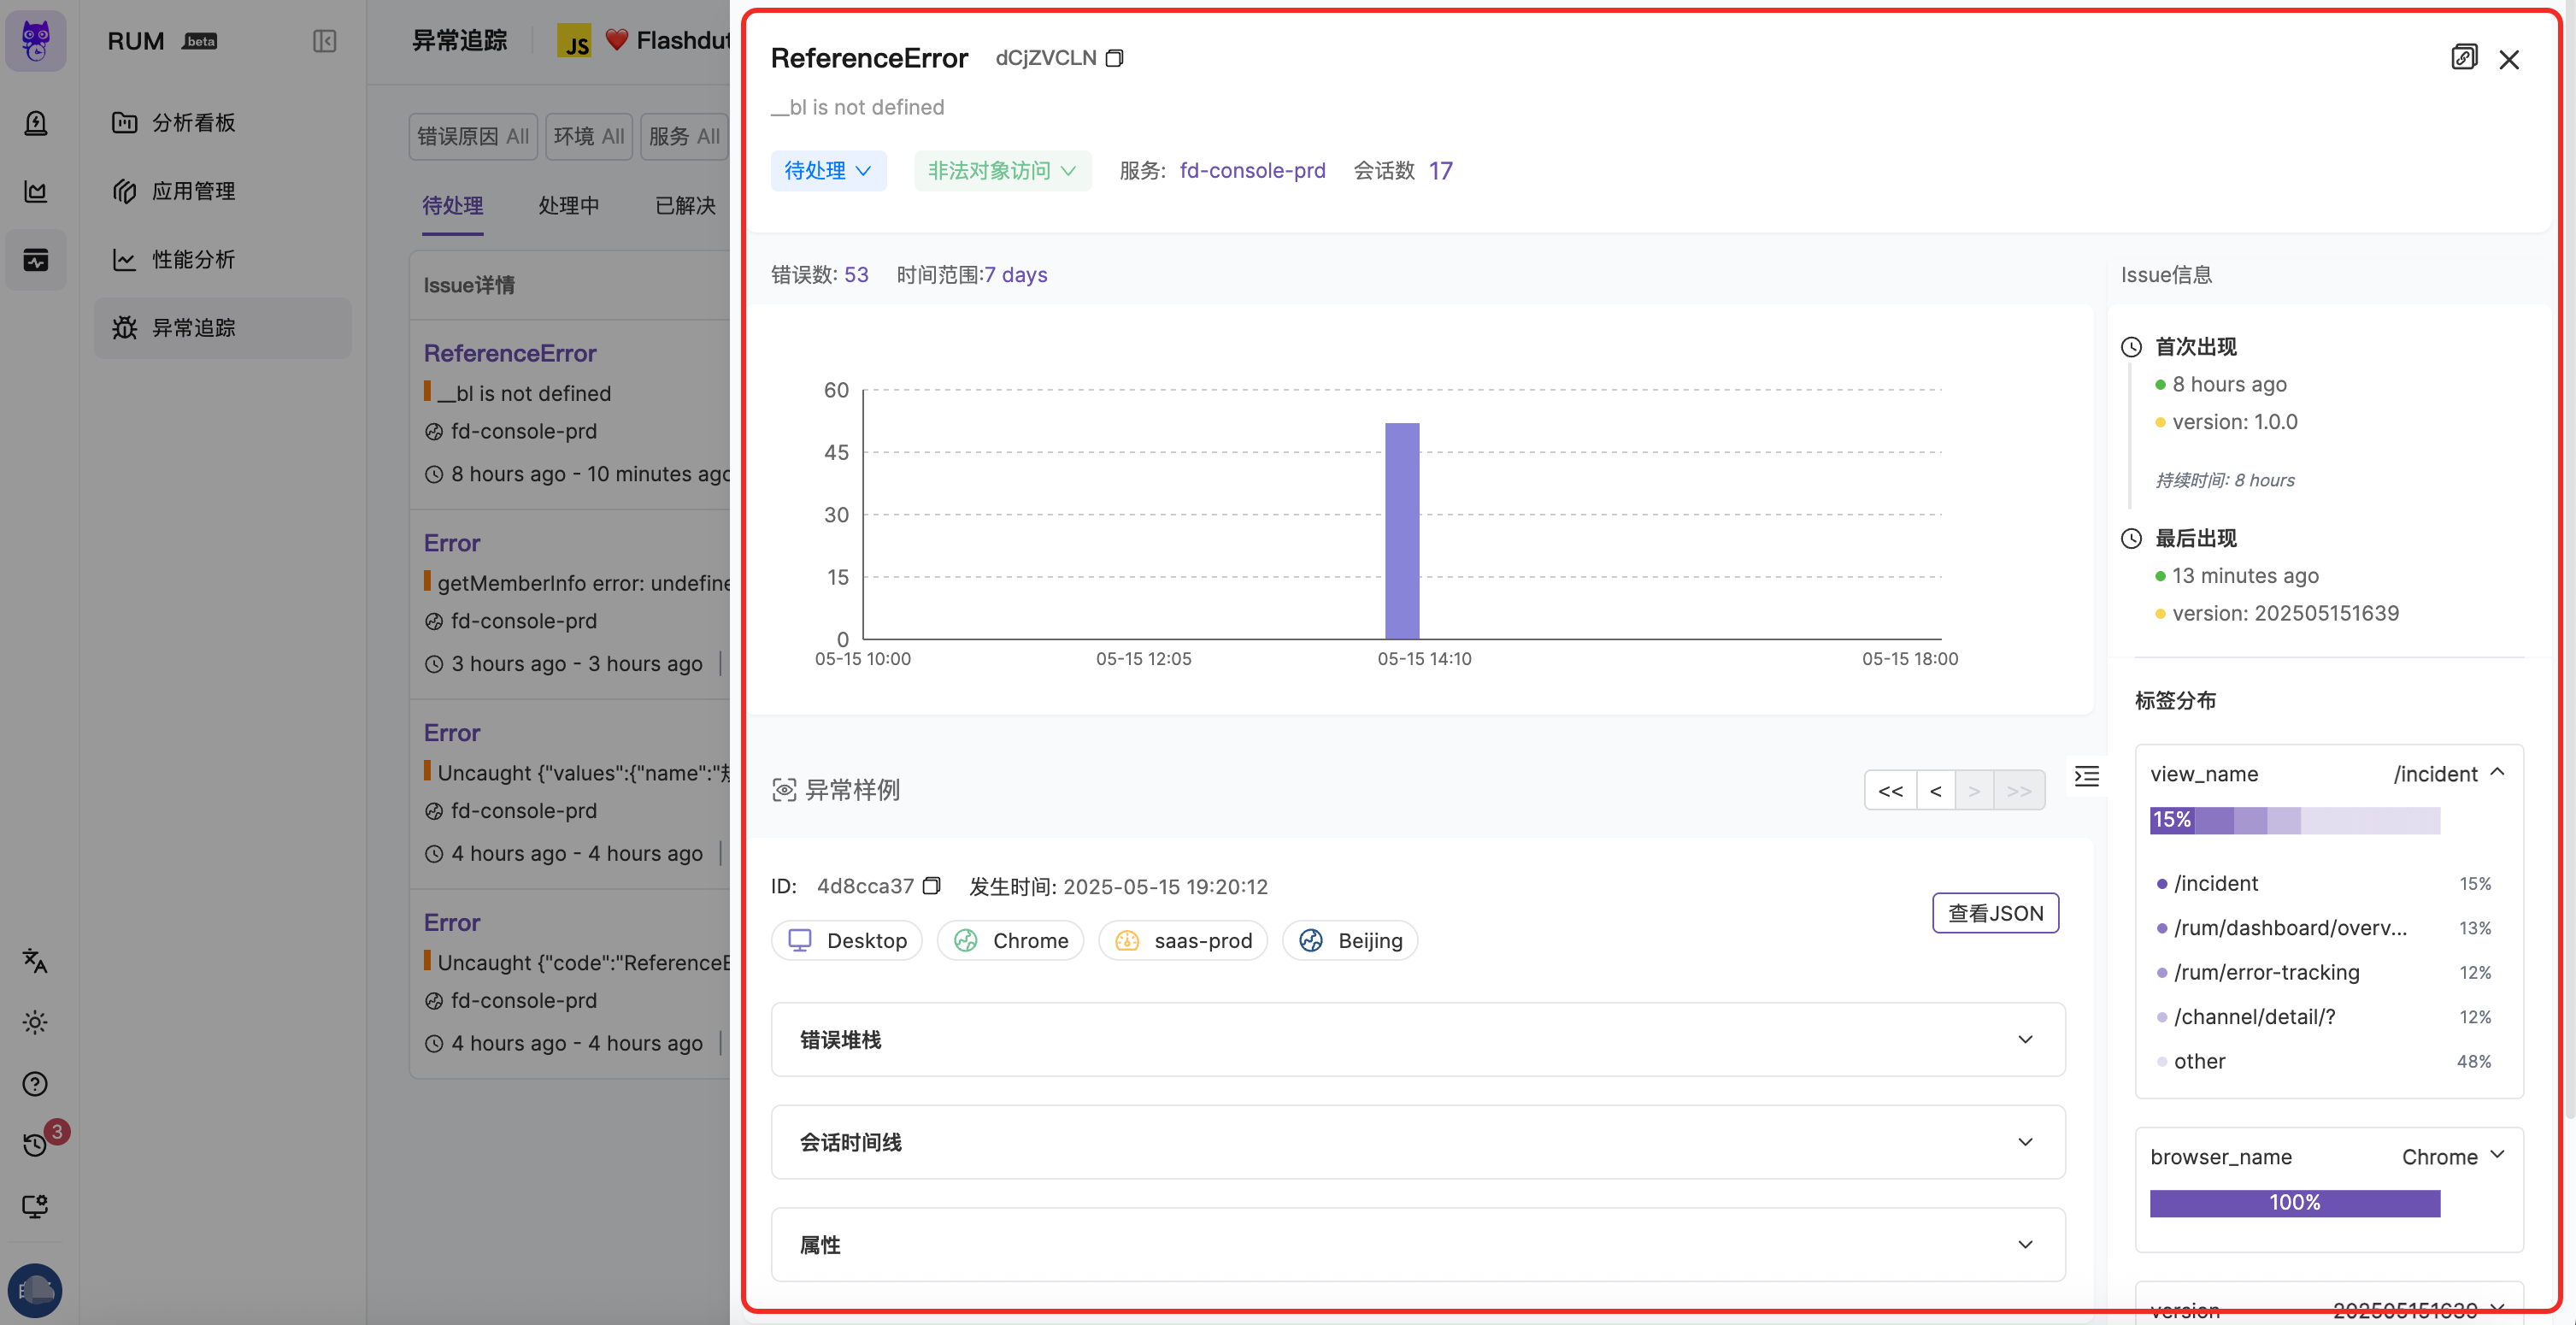 The top of the panel displays basic Issue information, such as status and error cause. You can also understand the Issue lifecycle: first and last occurrence dates, duration, and error occurrence count over time (aggregated by time granularity).
In the label distribution section, you can view the proportion of different labels under this Issue across various dimensions, quickly determining the impact scope and helping locate root causes.
Currently supports labels like `view_name`, `browser_name`, `version`, `env`, etc.
By default, displays the most recent error information reported during the Issue's occurrence as an error sample. You can also switch through the navigation bar.
For native crashes, each sample in the navigation list carries a symbolication badge ("Parsed" / "Unparsed"). When the latest sample cannot be symbolicated but an older sample can, the detail auto-switches to the symbolatable sample and shows the notice "Switched to a sample that can be symbolicated (the latest one is not)." Click "Back to latest" to return to the most recent sample. The auto-switch tries at most 5 older samples; if none of them can be symbolicated, the detail switches back to the latest sample and stops auto-switching.
View error context and stack information. If the corresponding SourceMap, Android mapping file, iOS dSYM file, or Flutter symbol file has been uploaded, you can see mapped original source code locations and code snippets.
The top of the panel displays basic Issue information, such as status and error cause. You can also understand the Issue lifecycle: first and last occurrence dates, duration, and error occurrence count over time (aggregated by time granularity).
In the label distribution section, you can view the proportion of different labels under this Issue across various dimensions, quickly determining the impact scope and helping locate root causes.
Currently supports labels like `view_name`, `browser_name`, `version`, `env`, etc.
By default, displays the most recent error information reported during the Issue's occurrence as an error sample. You can also switch through the navigation bar.
For native crashes, each sample in the navigation list carries a symbolication badge ("Parsed" / "Unparsed"). When the latest sample cannot be symbolicated but an older sample can, the detail auto-switches to the symbolatable sample and shows the notice "Switched to a sample that can be symbolicated (the latest one is not)." Click "Back to latest" to return to the most recent sample. The auto-switch tries at most 5 older samples; if none of them can be symbolicated, the detail switches back to the latest sample and stops auto-switching.
View error context and stack information. If the corresponding SourceMap, Android mapping file, iOS dSYM file, or Flutter symbol file has been uploaded, you can see mapped original source code locations and code snippets.
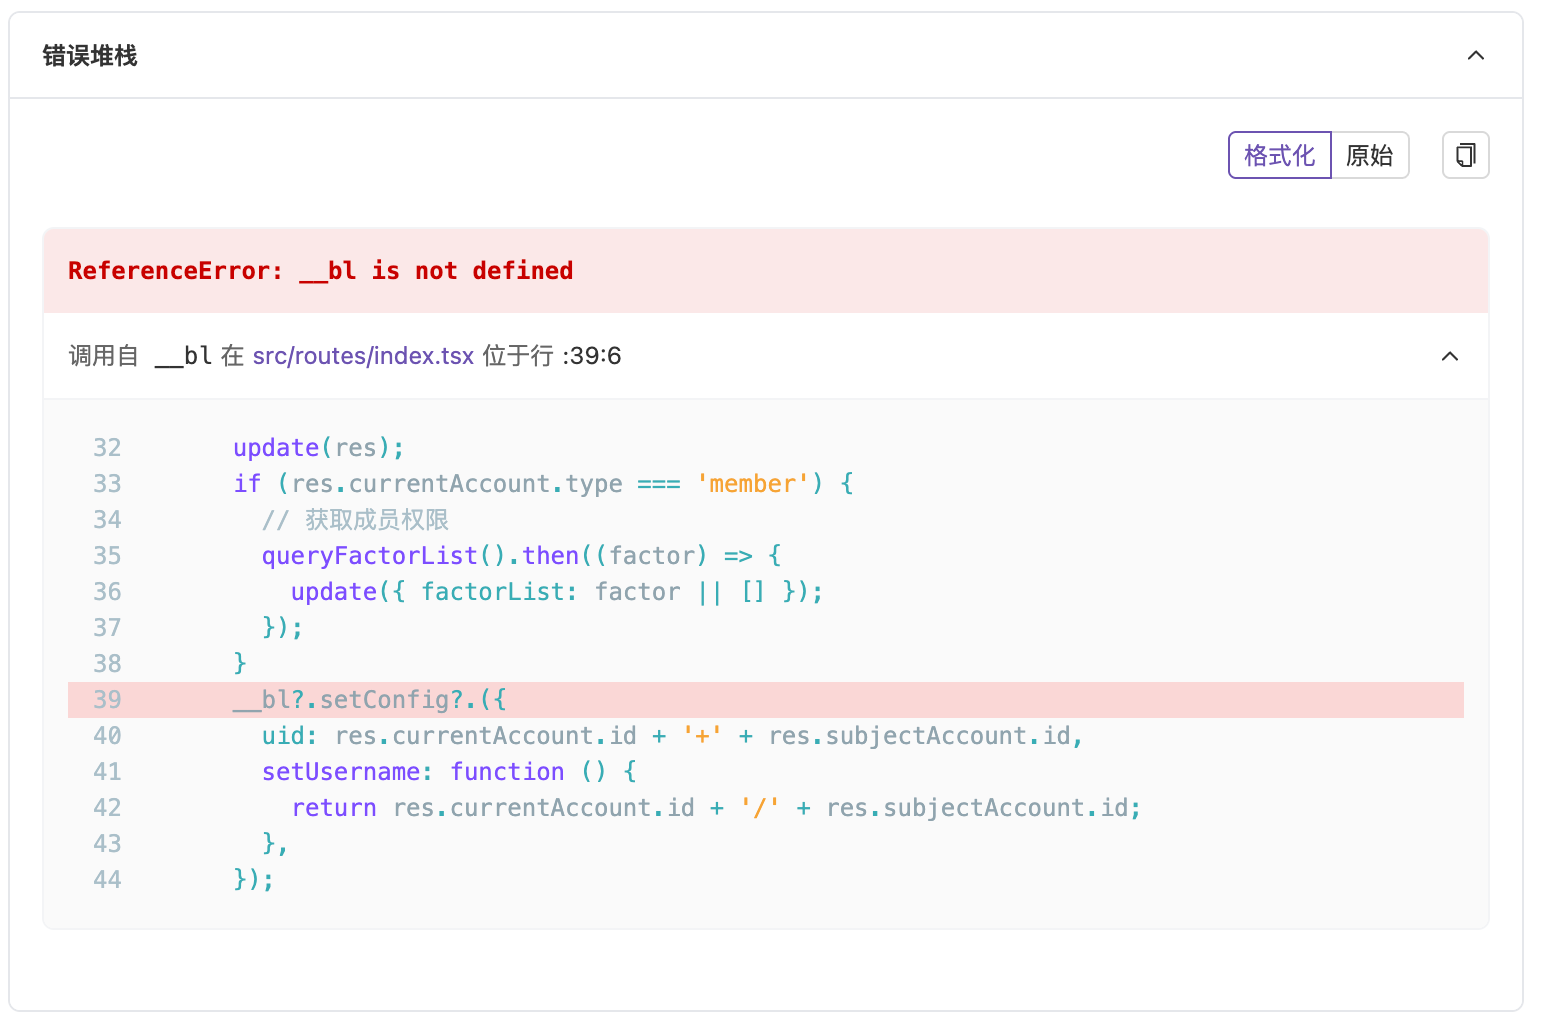 You can view uploaded source code information in "Application Management" - "Source Code Management". See [Source Mapping](./source-mapping) for details.
The error stack display for native platforms (Android/iOS) is specifically designed for mobile characteristics, providing the following capabilities:
**Pretty / Raw Mode Toggle**
* **Pretty Mode**: Displays structured stack information, automatically distinguishing between app frames and third-party frames. Third-party frames are collapsed by default, highlighting your own code
* **Raw Mode**: Displays raw stack text for easy copying and analysis in external tools
**Symbolication Status**
If the corresponding version's symbol files (Android mapping or iOS dSYM) have been uploaded, obfuscated addresses in the stack are automatically restored to readable function names, file names, and line numbers. When not symbolicated, the system prompts you to upload symbol files with direct links to "Source Code Management" and the upload tool.
Symbolication results are cached. After uploading symbols for a crash you have already seen, click the "Re-symbolicate" button in the notice bar or in the "Symbols required by this crash" section to bypass the cache and force a full re-run of symbolication (including re-fetching dSYMs), then refresh the stack — no need to wait for a new occurrence.
**Thread Stacks (Threads)**
Native crashes typically involve multiple threads. The thread panel displays stack information for all threads at the time of the crash, supporting:
* Viewing total thread count and currently displayed threads
* Expanding/collapsing all threads
* Independent separation of app frames and third-party frames within each thread, with third-party frames expandable on demand
* The crashing thread's stack is displayed first
**Binary Images (iOS)**
For iOS crashes, you can also view the list of Binary Images loaded at the time of the crash, including image names, address ranges, and UUIDs, for offline symbolication analysis.
**Symbols Required by This Crash (Non-System)**
When a crash carries non-system binary images (native crashes that resolve addresses through binary images, such as iOS and Electron, including Flutter's iOS native crashes), a "Symbols required by this crash (non-system)" section appears above the stack, listing every non-system binary image this crash references and its symbolication status:
* The section header summarizes the status as "symbolicated/total symbolicated"; it collapses to a one-line summary when everything is resolved and expands by default while anything is missing
* Each image is a row showing its name, UUID, and a "Parsed" / "Unparsed" badge, with a copy-UUID button
* "Look up in symbol list" opens the Source Mapping page pre-filtered by that image's UUID
* Unparsed images also provide an "Upload" link that goes straight to the upload entry of the Source Mapping page
* While anything is unresolved, the "Re-symbolicate" button in the section forces a fresh symbolication run and refreshes the stack
**Flutter Support**
Flutter native crashes (with `source_type` of `ndk`, `android`, or `ios`) carry thread stacks and Binary Images, and are rendered with the same native view described above as Android/iOS native crashes. Dart exceptions are symbolicated by matching the build\_id in the stack against uploaded Flutter symbol files.
**React Native Support**
React Native has the same shape as Flutter: JS errors render as Web stacks and are symbolicated against uploaded JS sourcemaps, while native crashes (with `source_type` of `ios`, `android`, or `ndk`) carry thread stacks and Binary Images and are rendered with the native stack view described above, symbolicated via dSYM / NDK symbol files like standalone Android/iOS crashes. JS error sourcemap lookup is scoped to the `react-native` type and further narrowed by the platform derived from the error's OS (`os_name`) — iOS and Android bundles may share a file name, and the platform scoping prevents matching the other side's file.
**Electron Support**
Electron errors are routed by type: main-process and renderer JavaScript errors are V8 stacks and render exactly like browser errors in the Web stack view (original source is restored once a source map is uploaded), while minidump native crashes are address-style native stacks (with threads and `binary_images`) rendered in the native stack view above — uploading matching Breakpad symbols restores function names, file names, and line numbers. See [Electron error symbolication](../sdk/electron/error-symbolication).
For detailed symbol file upload procedures, see [Source Mapping](./source-mapping).
View the total number of Session events for the current error sample, as well as user resource access and operations before and after the error occurred.
Currently displays up to 20 context items including the current Error event. You can view more log information in the Session Viewer module later.
If the session has replay data collected, you can click the "View Replay" button to jump directly to the session replay page, recreating the complete user operation path when the error occurred from the user's perspective.
Error events carry a series of attributes when reported. You can view current Session, view, user, and other information in the attributes section to help troubleshoot issues.
For Electron errors, the attributes panel additionally shows a virtual `process` attribute (main process / renderer process) in the Other attribute group, indicating which runtime the error came from; non-Electron errors do not show this attribute.
## Issue Alerts
Discover problems immediately when they occur, giving you the opportunity to proactively identify and fix them before they become severe.
You can view uploaded source code information in "Application Management" - "Source Code Management". See [Source Mapping](./source-mapping) for details.
The error stack display for native platforms (Android/iOS) is specifically designed for mobile characteristics, providing the following capabilities:
**Pretty / Raw Mode Toggle**
* **Pretty Mode**: Displays structured stack information, automatically distinguishing between app frames and third-party frames. Third-party frames are collapsed by default, highlighting your own code
* **Raw Mode**: Displays raw stack text for easy copying and analysis in external tools
**Symbolication Status**
If the corresponding version's symbol files (Android mapping or iOS dSYM) have been uploaded, obfuscated addresses in the stack are automatically restored to readable function names, file names, and line numbers. When not symbolicated, the system prompts you to upload symbol files with direct links to "Source Code Management" and the upload tool.
Symbolication results are cached. After uploading symbols for a crash you have already seen, click the "Re-symbolicate" button in the notice bar or in the "Symbols required by this crash" section to bypass the cache and force a full re-run of symbolication (including re-fetching dSYMs), then refresh the stack — no need to wait for a new occurrence.
**Thread Stacks (Threads)**
Native crashes typically involve multiple threads. The thread panel displays stack information for all threads at the time of the crash, supporting:
* Viewing total thread count and currently displayed threads
* Expanding/collapsing all threads
* Independent separation of app frames and third-party frames within each thread, with third-party frames expandable on demand
* The crashing thread's stack is displayed first
**Binary Images (iOS)**
For iOS crashes, you can also view the list of Binary Images loaded at the time of the crash, including image names, address ranges, and UUIDs, for offline symbolication analysis.
**Symbols Required by This Crash (Non-System)**
When a crash carries non-system binary images (native crashes that resolve addresses through binary images, such as iOS and Electron, including Flutter's iOS native crashes), a "Symbols required by this crash (non-system)" section appears above the stack, listing every non-system binary image this crash references and its symbolication status:
* The section header summarizes the status as "symbolicated/total symbolicated"; it collapses to a one-line summary when everything is resolved and expands by default while anything is missing
* Each image is a row showing its name, UUID, and a "Parsed" / "Unparsed" badge, with a copy-UUID button
* "Look up in symbol list" opens the Source Mapping page pre-filtered by that image's UUID
* Unparsed images also provide an "Upload" link that goes straight to the upload entry of the Source Mapping page
* While anything is unresolved, the "Re-symbolicate" button in the section forces a fresh symbolication run and refreshes the stack
**Flutter Support**
Flutter native crashes (with `source_type` of `ndk`, `android`, or `ios`) carry thread stacks and Binary Images, and are rendered with the same native view described above as Android/iOS native crashes. Dart exceptions are symbolicated by matching the build\_id in the stack against uploaded Flutter symbol files.
**React Native Support**
React Native has the same shape as Flutter: JS errors render as Web stacks and are symbolicated against uploaded JS sourcemaps, while native crashes (with `source_type` of `ios`, `android`, or `ndk`) carry thread stacks and Binary Images and are rendered with the native stack view described above, symbolicated via dSYM / NDK symbol files like standalone Android/iOS crashes. JS error sourcemap lookup is scoped to the `react-native` type and further narrowed by the platform derived from the error's OS (`os_name`) — iOS and Android bundles may share a file name, and the platform scoping prevents matching the other side's file.
**Electron Support**
Electron errors are routed by type: main-process and renderer JavaScript errors are V8 stacks and render exactly like browser errors in the Web stack view (original source is restored once a source map is uploaded), while minidump native crashes are address-style native stacks (with threads and `binary_images`) rendered in the native stack view above — uploading matching Breakpad symbols restores function names, file names, and line numbers. See [Electron error symbolication](../sdk/electron/error-symbolication).
For detailed symbol file upload procedures, see [Source Mapping](./source-mapping).
View the total number of Session events for the current error sample, as well as user resource access and operations before and after the error occurred.
Currently displays up to 20 context items including the current Error event. You can view more log information in the Session Viewer module later.
If the session has replay data collected, you can click the "View Replay" button to jump directly to the session replay page, recreating the complete user operation path when the error occurred from the user's perspective.
Error events carry a series of attributes when reported. You can view current Session, view, user, and other information in the attributes section to help troubleshoot issues.
For Electron errors, the attributes panel additionally shows a virtual `process` attribute (main process / renderer process) in the Other attribute group, indicating which runtime the error came from; non-Electron errors do not show this attribute.
## Issue Alerts
Discover problems immediately when they occur, giving you the opportunity to proactively identify and fix them before they become severe.
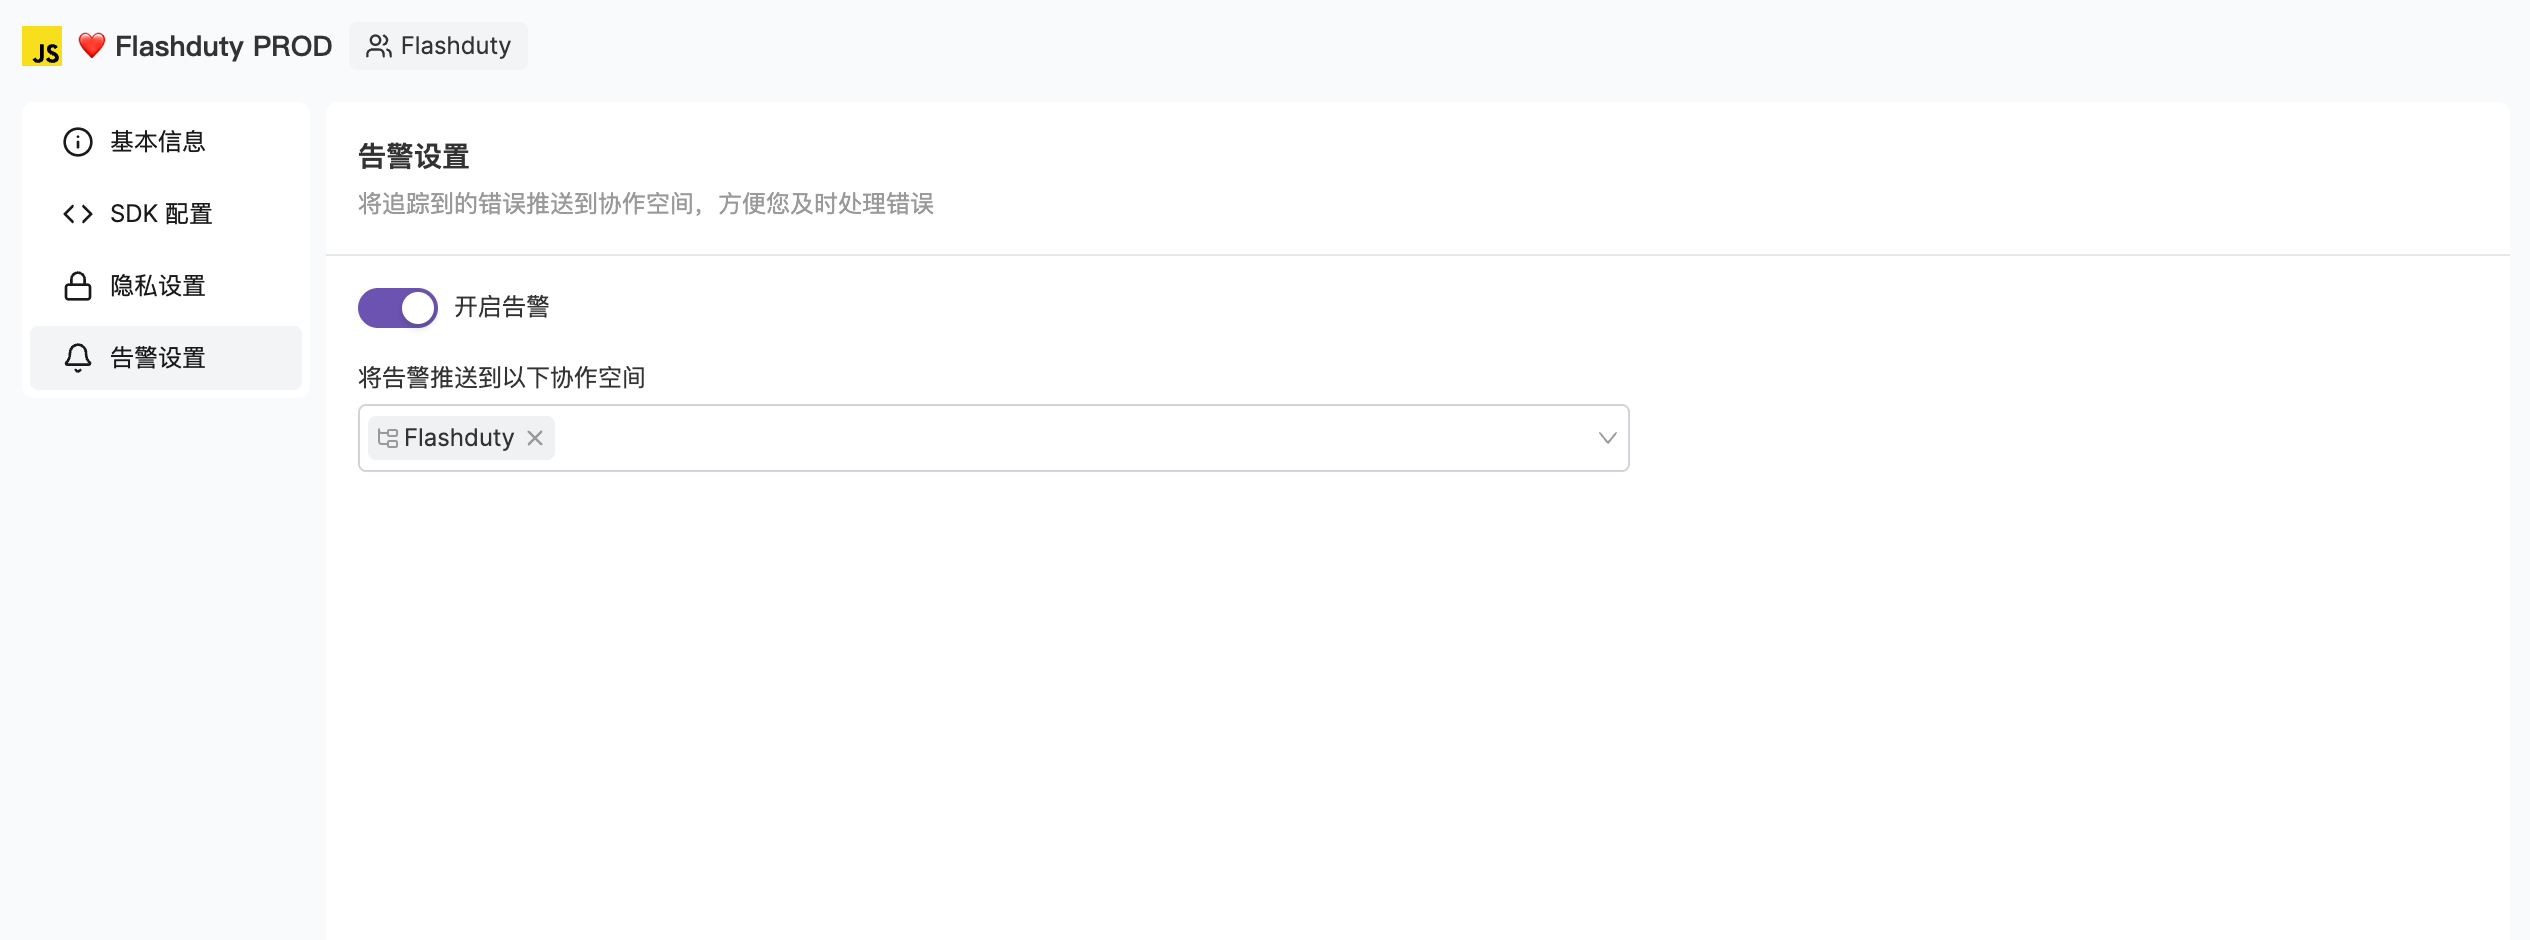 Select an application card and edit it
Turn on the "Alerts" switch
Select the notification channel
For detailed alert configuration instructions, please refer to [Issue Alerts](./issue-alerts).
## Best Practices
Facilitates problem localization in production environments
Configure user-related information to provide better error context
Configure appropriate channels and escalation rules for errors
Regularly check error reports to discover potential issues
Use team ownership features to ensure issues are quickly assigned to relevant teams
Closely monitor potential regressions of resolved issues
## Next Steps
Configure source mapping
Learn about grouping mechanisms
Manage Issue status
Select an application card and edit it
Turn on the "Alerts" switch
Select the notification channel
For detailed alert configuration instructions, please refer to [Issue Alerts](./issue-alerts).
## Best Practices
Facilitates problem localization in production environments
Configure user-related information to provide better error context
Configure appropriate channels and escalation rules for errors
Regularly check error reports to discover potential issues
Use team ownership features to ensure issues are quickly assigned to relevant teams
Closely monitor potential regressions of resolved issues
## Next Steps
Configure source mapping
Learn about grouping mechanisms
Manage Issue status